Chasing Progressives: Slot Contribution Rates and Jackpot Math in US Casinos
Chasing Progressives: Slot Contribution Rates and Jackpot Math in US Casinos
The Allure of Progressive Jackpots on US Slot Floors
Slot machines with progressive jackpots draw crowds in US casinos because those meters climb higher with every coin dropped, turning routine spins into potential life-changers; observers note how players cluster around machines showing seven-figure totals, chasing the dream of a payout that resets only after someone hits big. Data from the Nevada Gaming Control Board reveals that progressives accounted for over 15% of total slot win in Nevada during fiscal year 2025, a figure that underscores their popularity even as base game returns hover around 90-92%. But here's the thing: those jackpots don't grow in a vacuum, since casinos seed them with initial amounts and then feed them through precise contribution rates from player bets, creating a mathematical ecosystem where timing and odds collide.
Take wide-area progressives linked across multiple casinos or states; they pool contributions from thousands of machines, which explains why jackpots like Megabucks routinely surpass $10 million before payout, whereas local progressives tied to a single property might cap out much lower but hit more frequently. Researchers who've analyzed slot data point out that contribution rates typically range from 1% to 5% per wager, depending on the game and jurisdiction, and that's where players often overlook the fine print, assuming every dollar bet fuels the top prize equally when in reality, only specific bet levels or combinations qualify.
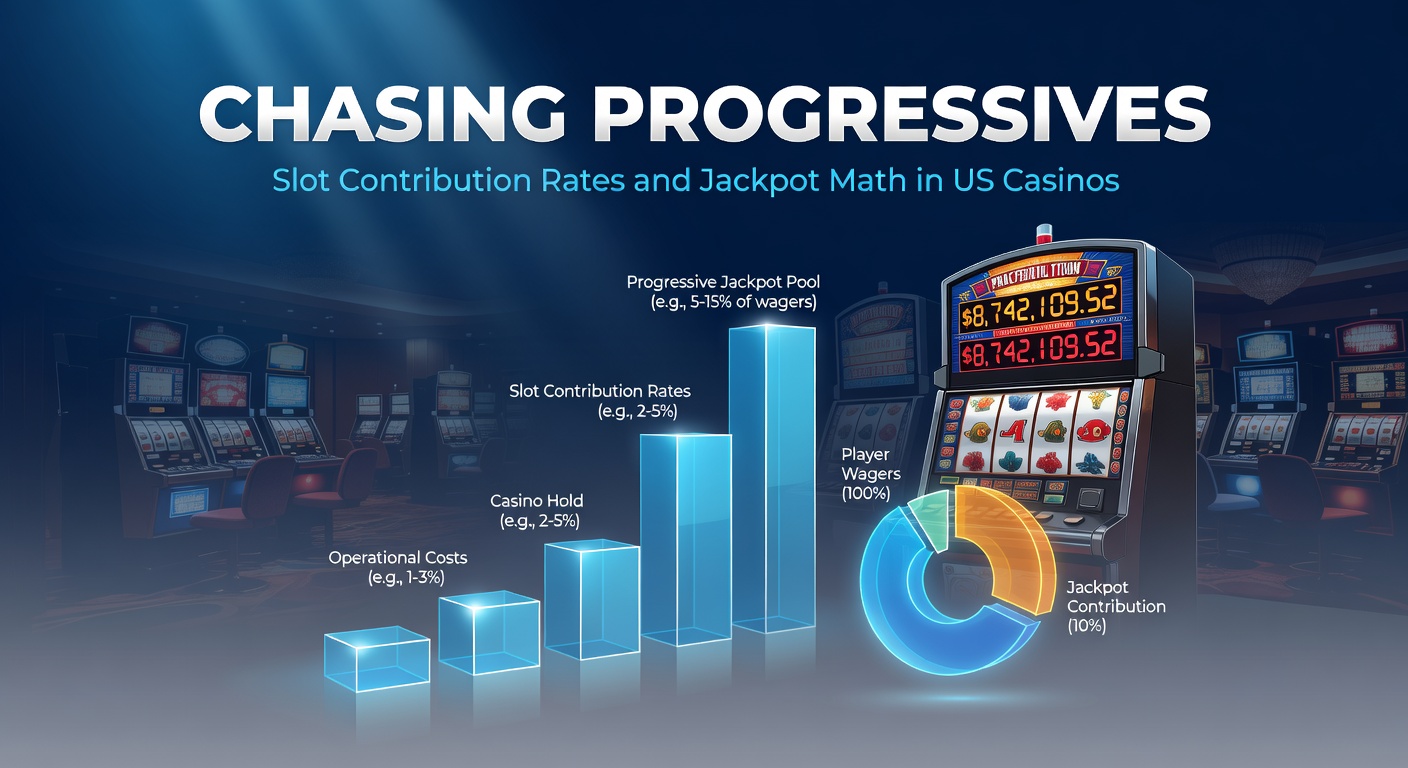
Breaking Down Slot Contribution Rates
Contribution rates represent the exact percentage of each qualifying wager that casinos divert directly to the progressive pool, a mechanism regulated tightly to ensure transparency; for instance, on a typical $3 Megabucks spin in Las Vegas, about 7-8% might funnel toward the jackpot meter, while the rest covers base game payouts, house edge, and operational costs. Figures from industry reports indicate that these rates vary widely: mystery progressives might skim as little as 0.5% because they trigger randomly below the meter display, but must-hit-by progressives ramp up to 2-3% to guarantee a drop at a preset amount, keeping players engaged through predictable escalation.
What's interesting is how casinos layer contributions across multiple tiers; a machine could allocate 1% to a mini jackpot, 2% to a major, and 4% to the grand progressive, so players betting maximum coins capture the full flow, whereas low rollers contribute less and chase smaller pots. Experts have observed this in action at properties like MGM Grand, where banked progressives—those funded entirely by players without seed money—demand higher rates around 5-10% to build quickly, but they come with steeper odds, often 1 in 50 million for the top prize. And yet, data shows savvy players track these rates via machine placards or casino apps, calculating when the expected value flips positive as the meter climbs.
Now consider network progressives spanning states like Nevada and New Jersey; they standardize rates at 2-4% to balance growth across jurisdictions, but local rules tweak them—for example, New Jersey mandates full disclosure of contribution percentages under Division of Gaming Enforcement guidelines, ensuring players know exactly how their bets build the beast.
The Math Behind Jackpot Builds and Payouts
Jackpot math boils down to simple yet relentless arithmetic: if a progressive pulls a 2% contribution from $1 million in daily handle across linked machines, it adds $20,000 to the meter each day, minus the house's programmed volatility that dictates hit frequency. Studies from the University of Nevada, Las Vegas Center for Gaming Research reveal that average time-to-hit for a $1 million progressive correlates inversely with contribution rates; higher rates mean faster growth, but casinos counter this by lengthening odds, so a 1-in-49,836,512 Megabucks shot stays consistent regardless of meter size.
Turns out, the real edge emerges when jackpot size exceeds the break-even point, calculated as seed amount divided by contribution rate plus base game RTP adjustment; for a game with 88% base RTP and 2% contribution, players break even around 50 times the average hit amount, a threshold Megabucks often blasts past during hot streaks. Observers note how this math plays out in real time: in April 2026, a $39.7 million Megabucks win at Excalibur in Las Vegas reset a meter that had accrued from 3% contributions on max $3 bets across Nevada, drawing from over 600 machines and highlighting how interstate networks amplify the pool.

But here's where it gets interesting with must-hit-by progressives, now proliferating in US casinos; these promise a drop before reaching a hidden cap, say $1,500 for a mini, funded by steady 1.5% drips, so mathematical models predict 95% of hits occur in the final 10% of the climb, turning them into de facto positive EV plays late in the cycle. One case saw a Pennsylvania casino's $10,000 major progressive must-hit-by explode at $9,987 after absorbing 2.8% from $2 million in wagers, a payout that data from the American Gaming Association tracks as part of a national trend where progressives delivered $2.4 billion in wins during 2025.
People who've crunched the numbers often discover volatility's role too; high-contribution slots swing wildly because less money funds base hits, concentrating action on the progressive chase, whereas balanced games spread it out, making for smoother sessions but slower meter climbs.
US Casino Variations and Regulatory Oversight
Casinos across the US tailor progressive structures to state laws, with Nevada leading in wide-areas due to laxer pooling rules, while tribal lands in Oklahoma or California emphasize in-house banks with 4-6% rates to hit frequently amid compact restrictions. Data indicates Atlantic City slots lean toward 1-2% contributions for multi-tiered progressives, reflecting New Jersey's push for competitive RTPs above 92%, and that's notable because it squeezes house margins, forcing operators to hike base volatility.
So regulators step in: the Mississippi Gaming Commission requires audited contribution disclosures quarterly, ensuring no hidden fees erode player funds, whereas Michigan's Gaming Control Board mandates minimum seeds for standalone progressives, preventing eternal climbs that frustrate bettors. And in April 2026, Colorado's Limited Gaming Control Commission announced phased-in caps on wide-area contribution rates at 3.5% to curb monopoly-like pools dominated by big operators, a move experts predict will spawn more regional jackpots.
There's this case from Detroit where a local progressive linked 50 MotorCity Casino slots at 2.2% contribution; it hit $250,000 after 18 days, paying out to a max-betting regular who timed entry when the meter crossed 80% of average hit value, illustrating how public meters and rate placards empower informed play.
- Wide-area networks: 1-3% rates, massive pots, 1-in-tens-of-millions odds.
- Local banks: 3-7% rates, mid-five-figure prizes, better frequency.
- Mystery/must-hit: 0.5-2%, smaller but predictable wins.
Yet tribal casinos add twists; under the Indian Gaming Regulatory Act, they self-regulate rates but report to the National Indian Gaming Commission, often hitting 5%+ on high-limit progressives to lure whales, resulting in outsized payouts like the $1.3 million drop at Foxwoods in Connecticut last year.
Player Patterns and Observable Trends
Those who've studied casino floors notice patterns in progressive chasing: groups rotate machines to spread contributions, while solo players hunt "due" meters using apps tracking historical hits, although randomness reigns supreme since each spin stands alone. Research shows positive EV windows open briefly—perhaps 5-10% of the time for majors—prompting bankroll managers to wait out the math rather than dive in early.
It's noteworthy that mobile-linked progressives, surging in 2026, blend online and land-based contributions at 1.5-2.5%, letting apps like BetMGM's feed Vegas meters, a hybrid model Pennsylvania legalized last year to boost cross-play. One researcher documented a $500,000 online-fed jackpot claimed at Caesars Palace, where remote bets at 1.8% rate pushed it over the edge.
Conclusion
Progressive slot math in US casinos hinges on contribution rates that dictate growth speed and payout scale, balanced against odds that keep houses profitable long-term; data confirms jackpots deliver thrilling highs, from Megabucks marathons to must-hit micros, while regulations ensure fairness across states. Players tracking meters and rates uncover fleeting edges, but the reality is disciplined chasing beats blind hope every time, as evidenced by billions in tracked wins fueling the endless pursuit. With April 2026 bringing tighter caps and hybrid networks, the landscape evolves, yet the core equation—contributions in, jackpots out—remains the game's beating heart.