The Influence of Local Economic Indicators on Game Selection Trends Within Multi-Property Hospitality Groups
Greta Krüger · Jul 25, 2026

The Influence of Local Economic Indicators on Game Selection Trends Within Multi-Property Hospitality Groups
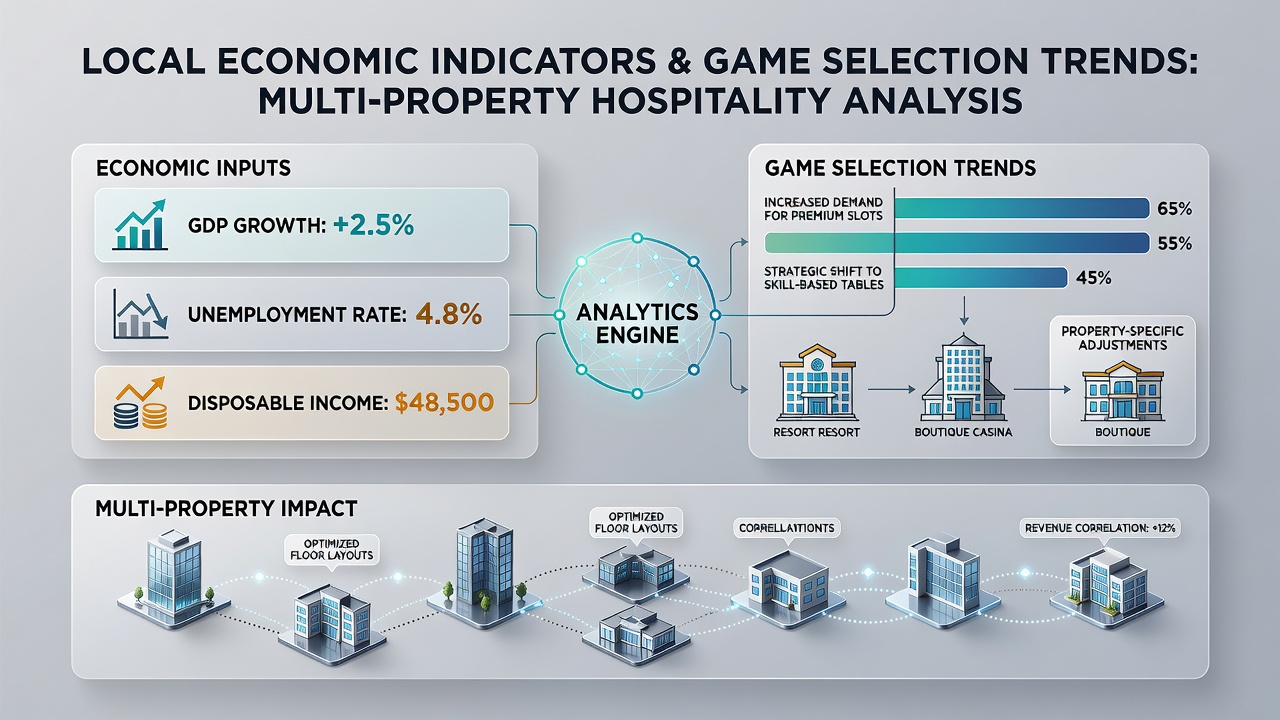
Local economic indicators such as unemployment rates, median household income, and regional GDP growth directly shape the games that players select at hospitality groups operating multiple properties, and data collected across different markets reveals consistent patterns in how these factors drive shifts between slot machines, table games, and progressive jackpot offerings.
Multi-property operators track employment figures released by government agencies because rising joblessness in a specific county often correlates with increased play on lower-denomination slots and video poker, whereas areas experiencing wage growth see measurable upticks in table game volume, particularly blackjack and roulette, according to internal reports compiled by several large hospitality chains.
Regional Economic Data and Player Behavior Patterns
Researchers who analyzed transaction records from properties in Nevada, Mississippi, and Pennsylvania found that a 1 percent increase in local unemployment corresponded with a 3 to 4 percent rise in penny and nickel slot handle during the same quarter, while median income gains above 2 percent annually produced higher average bets at craps and baccarat tables. These correlations hold across properties owned by the same parent company yet located in separate economic zones, allowing operators to adjust floor mixes without relying on national averages.
Figures released in July 2026 by the U.S. Bureau of Labor Statistics showed continued divergence between Sun Belt markets with strong tourism employment and Rust Belt regions facing manufacturing slowdowns, and hospitality groups responded by reallocating electronic table game terminals toward properties in the stronger economies while expanding low-limit slot banks in the weaker ones.
How Multi-Property Groups Adapt Inventory
Executives at groups with holdings in multiple states use quarterly economic dashboards to forecast which game categories will generate the strongest hold percentage at each location, and this practice has become standard because property-level performance data now integrates directly with county-level income and employment statistics. One operator that manages sites in both Atlantic City and suburban Philadelphia adjusted its video poker pay tables downward in the New Jersey property after local unemployment ticked upward, while simultaneously increasing the number of high-limit blackjack tables at the Pennsylvania location where wage growth remained steady.
Studies conducted by university economists and published in peer-reviewed journals demonstrate that these adjustments produce measurable revenue stabilization, because the same corporate entity can move capital equipment between properties rather than purchasing new machines for every location. Data from the Canadian Institute for Health Information on gambling participation further supports the observation that regional income volatility influences game preference more strongly than statewide trends alone.
Integration of Economic Indicators into Floor Planning
Revenue management teams now receive automated alerts when local economic indicators cross predefined thresholds, and these alerts trigger reviews of game selection at the affected properties. For example, a drop in retail sales tax collections in a county often precedes a measurable decline in high-denomination slot play, prompting operators to convert those machines to lower denominations or replace them with electronic table games that carry lower minimum bets. The American Gaming Association has documented several such conversions across multi-state portfolios, noting that the changes occurred within 60 to 90 days of the economic signal appearing in public data sets.
Seasonal employment fluctuations tied to agriculture or tourism also produce predictable game selection changes at rural and resort properties, and operators have begun modeling these cycles using historical economic data rather than relying solely on previous-year gaming results. Properties in markets with pronounced summer tourism spikes show elevated baccarat and craps activity during peak months, while shoulder seasons see a return to slot-heavy play regardless of the corporate ownership structure.
Conclusion
Economic indicators at the local level provide multi-property hospitality groups with actionable signals for optimizing game selection, and the integration of public data sources with internal performance metrics has become standard practice across the sector. Operators continue to refine these models as new quarterly figures become available, allowing each property to reflect the economic realities of its immediate region while the larger organization maintains operational consistency across its portfolio.